dev
Game of Thrones Ratings: A Case Study
The Game of Thrones series has been a part of our lives for 10 years now and they recently lowered the curtains on Season 8. Everyone had an opinion from who should've killed whom to who should've sat on the throne. Like the geeks we were, we dug into the GOT data to understand the highs and lows of one of our favorite shows. So, read on to find out more.
Karthik Kamalakannan / 27 June, 2019

The Game of Thrones series has been a part of our lives for 10 years now and they recently lowered the curtains on Season 8. While being one of the epic shows of all times, the latest season has gathered a lot of flak for it's ending.
Everyone had an opinion from who should've killed whom to who should've sat on the throne. Like the geeks we were, we dug into the GOT data to understand the highs and lows of one of our favorite shows.
So, read on to find out more.
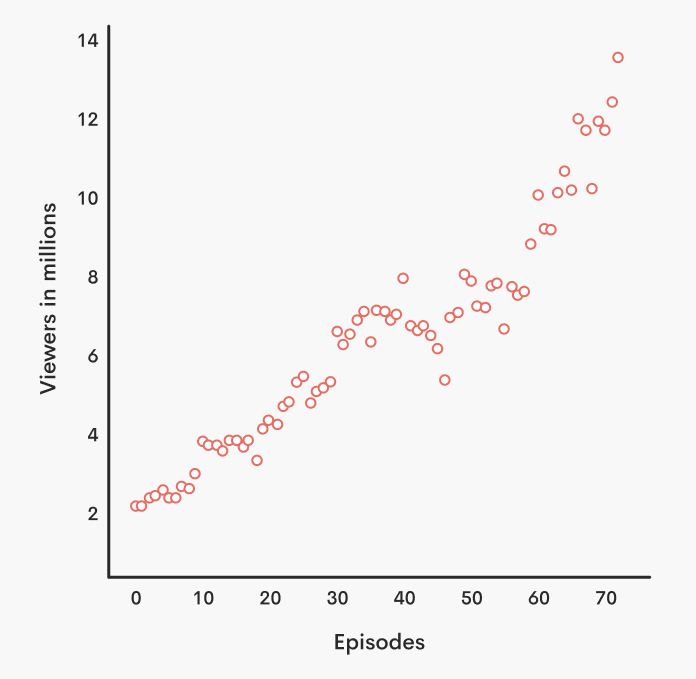
Before we start, we need a fair idea about how popular and far GOT has become since the first episode aired in 2011.
Gathering Data
With social media around us, there is no shortage of data, the primary data used in this analysis are from TV Series Finale and IMDB. There are tons of data points that can be mined using this package. I have chosen to gather the individual episode ratings, number of voters and episode details.
Next up is cleaning the data and choosing the best medium to represent it.
Normalizing Data
Studying the dataset, we quickly realize not all episodes have a similar number of voters which in turn affect the ratings. In order to fix that, we simply normalize the ratings in accordance with the number of voters for each episode.
Representing The Data
Sometimes, we have a great dataset and don't understand how to represent the data in an understandable format. I chose an arrow plot to represent my data, (partly because it looks damn cool). If you are a beginner with this type of plot, here is a great place to start with. You can also take a look at this "sort of" article which served as inspiration as well.
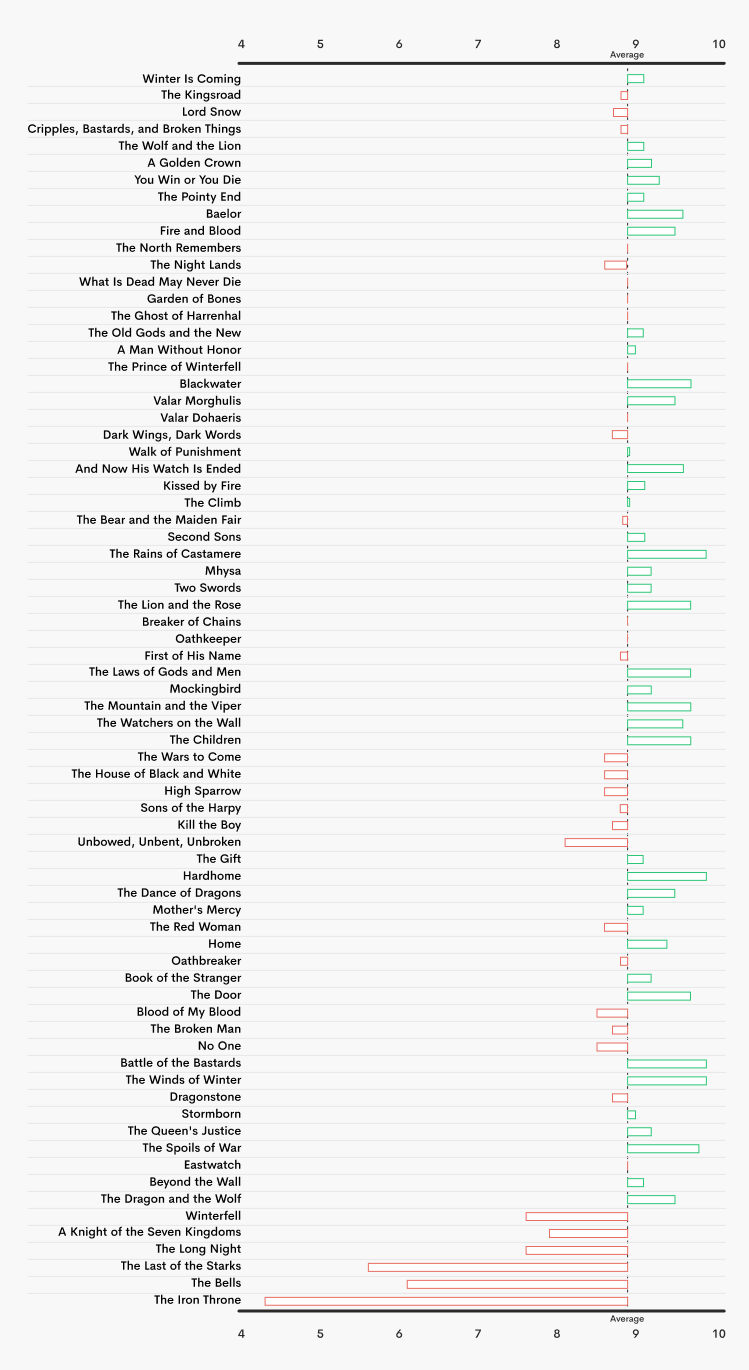
The above graph shows how the overall rating of the GOT show compares with each episode rating. The highest positive difference was The Rains of Castamere from Season 3 and Hardhome from Season 5 with a rating of 9.9. While the highest negative difference was The Iron Throne from Season 8 at just 4.3. Pretty representative of my feelings!

Can you tell me one difference between Season 8 Finale and the lowest rated episode? You can't because they're the same.
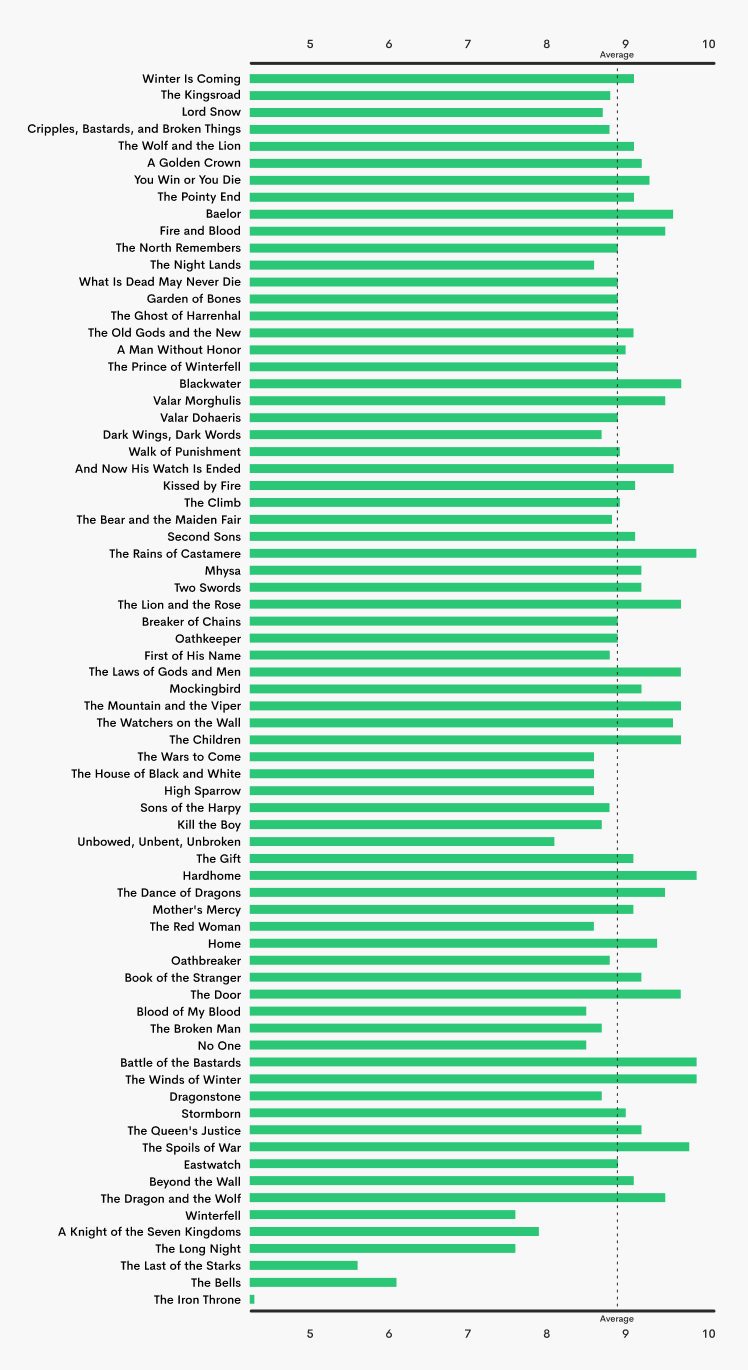
Okay, on that depressing note let's move to how each episode of the entire show fares again the last episode. Much less depressing, no?
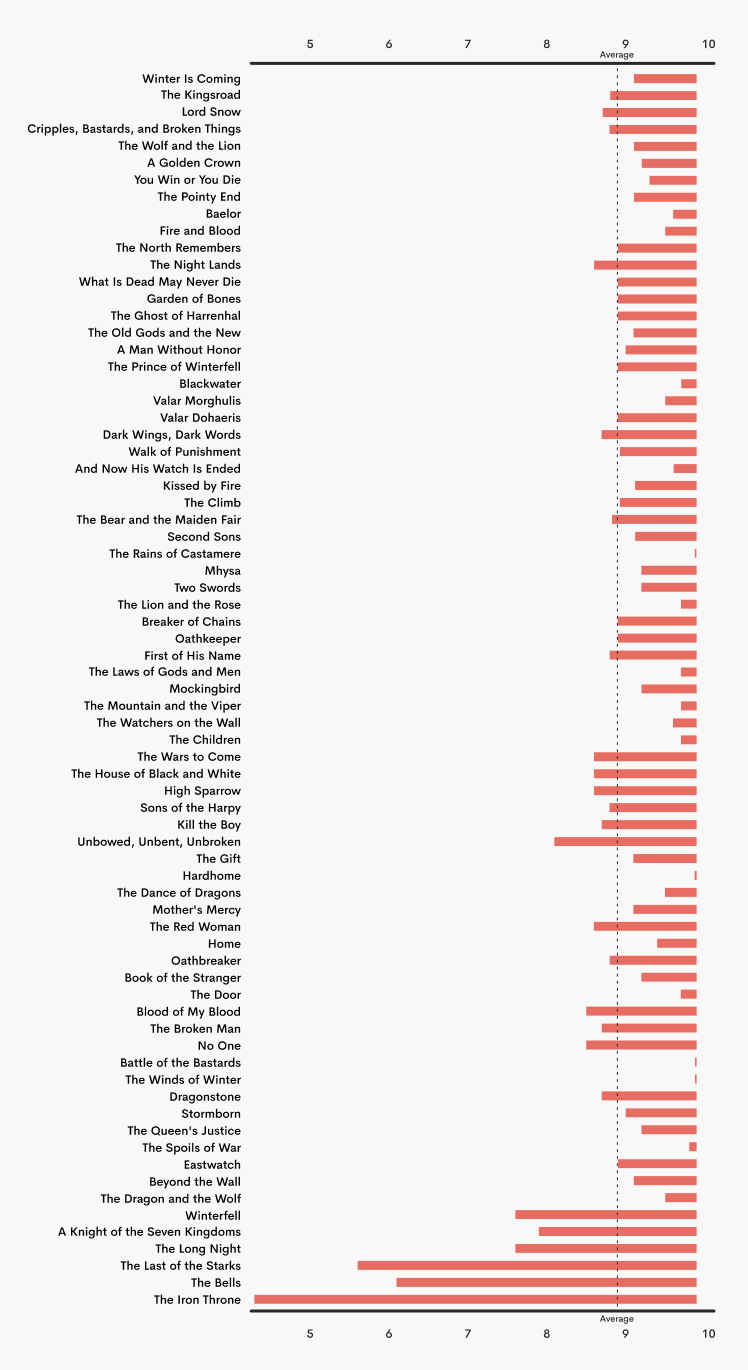
Where as here is a chart comparing the highest rated episodes in the whole series, namely "The Rains Of Castamere (S3E9)" and "Hardhome (S5E8)" with individual episode ratings.
For better or worse the "ending" of the Game of Thrones has been a part of our lives for 10 years, created and broken friendships, theories and brought us together as a community. We saw Arya grow into a fine young warrior, Sansa into a strong and fierce woman and little bear, Lyanna Mormont who single handedly made Jon, The King In The North when no one heard his call and got a glimpse at the caring side of the Hound - and that is what I consider a win.
Hope this analysis entertained you as much as the fun I had when making it.
Valar morgulis, amigos!
Last updated: January 23rd, 2024 at 1:50:36 PM GMT+0